Guide to Ichimoku cloud charts

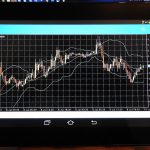
What is the Ichimoku cloud chart? Ichimoku cloud chart, also known as Ichimoku Kinko Hyo, is a technical analysis tool developed in Japan. It is used to identify trend direction, support and resistance levels, and potential price targets. The Ichimoku cloud chart consists of five lines: the Tenkan Sen (red), the Kijun Sen (blue), the […]
Read More   

An introduction to moving averages

The moving average (MA) is one of the most widely used indicators in technical analysis.   It uses past data to act as a guide for future decisions. The most common types are the simple, exponential and weighted moving averages (SMAs, EMAs & WMAs).   Moving averages smooth out random fluctuations in price data over […]

Read More   
Graph Showing Market Breakout

FX: What is the Relative Strength Index (RSI)

The RSI is a technical indicator used to quantify the gains and losses of an asset over time.   While it was initially designed for stocks, it can be applied to any tradable goods such as forex, cryptocurrencies or derivatives.   The RSI is expressed as a number between 0 and 100, with anything above […]

Read More   

The Pros and Cons of CFD (Contract for Difference)

Trending into the world of financial investments is both a risky and an exciting endeavor. While many have made astonishing fortunes trading, not all have had that luck. The difference comes down to the investment choice a trader settles for and their level of understanding of the same. You must find the most suitable investment […]

Read More   

9 FAQs about Forex CFDs and Their Updated Answers

If you struggle to understand forex CFDs, you should check out other traders’ frequent worries and their updated answers. It will be comfortable to decide if forex CFD trading suits you after reading this article. Read on to find out more below. 1.    What Happens When You Trade Forex CFDs? When you trade forex Contracts […]

Read More