The moving average (MA) is one of the most widely used indicators in technical analysis.
It uses past data to act as a guide for future decisions. The most common types are the simple, exponential and weighted moving averages (SMAs, EMAs & WMAs).
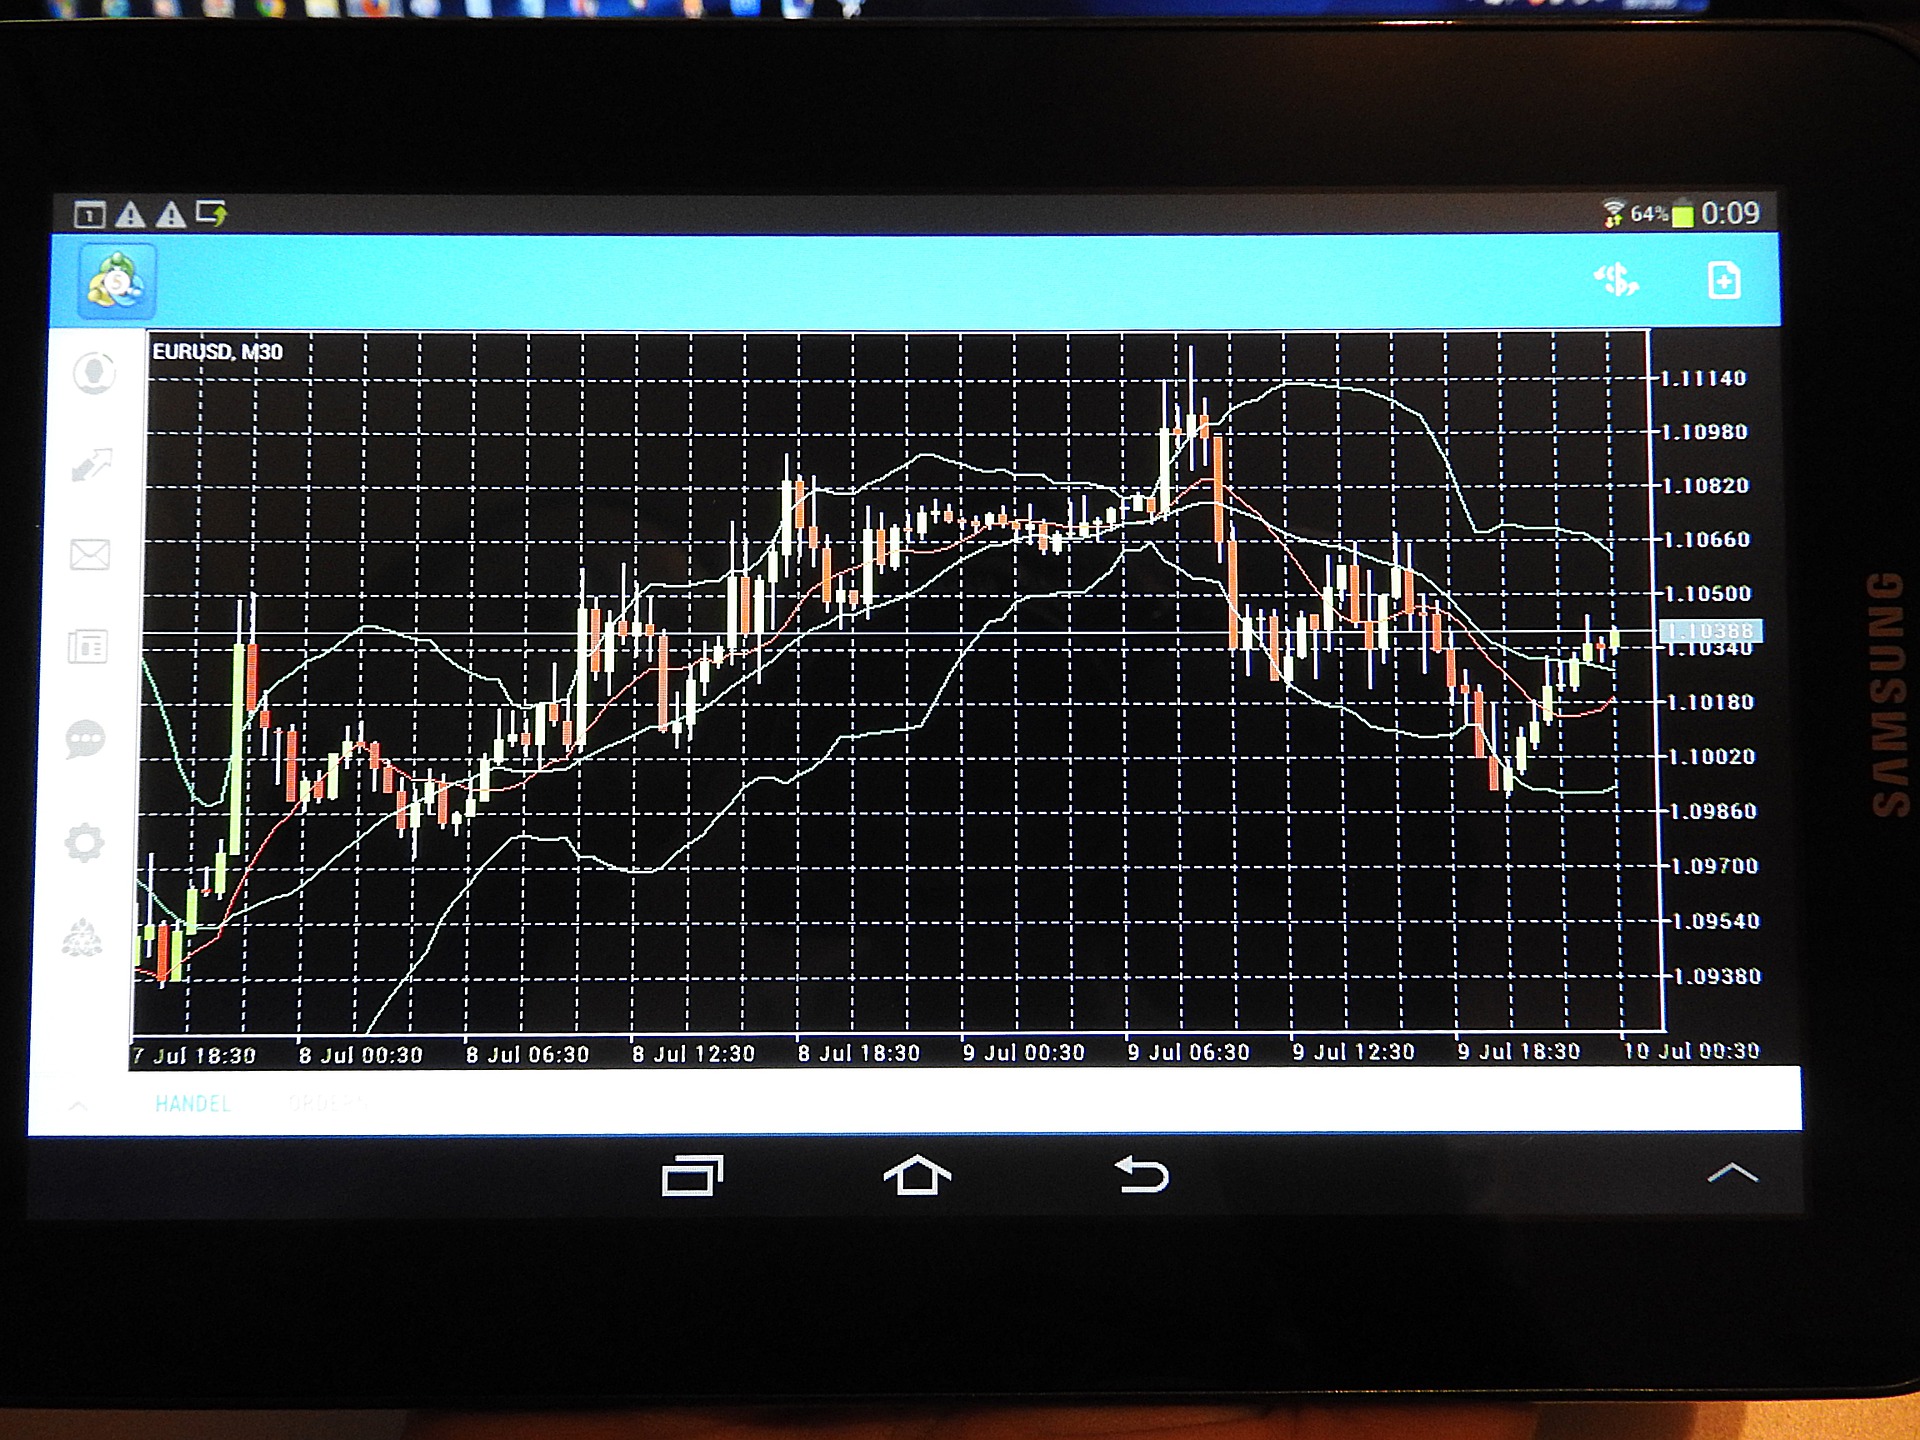
Moving averages smooth out random fluctuations in price data over time. They show the underlying trend of an asset by averaging prices together before displaying them on graph charts to be more easily read.
They are used to identify the current price trend of an asset by showing any significant changes in price direction.
They don’t predict future prices with accuracy; that’s not their role at all. To use them effectively, you need to understand their limits and how they fit within your strategy or risk losing money on trades you had thought were good ideas.
The best way to learn how they’re used is to practice using them yourself before reading more about how others have combined them with other indicators and strategies for profit. But if you’ve done that already, this article will expand on those ideas a little further, as well as explain some statistical properties of moving averages that few traders outside the financial industry understand.
Despite their simplicity, however, they can still be very effective as a means of directionally trading the markets.
Simple (SMAs)
The simple moving average is calculated by adding all of the closing prices over a chosen period and dividing that total by the number of prices included in the calculation.
A 10-day simple moving average, for example, is calculated by adding up all of today’s prices plus the previous nine days’ closing prices and then dividing that number by 11.
The same would be done for each subsequent day, so you’d have a value for ten days in the future – which would not happen because the second line represents tomorrow’s price(s) based on yesterday’s total.
As with most technical analysis-related, this isn’t an exact science just yet because there are no known ‘correct’ values to use as parameters.
Smooth or adjusted
Then there are three variations on that theme, known as either ‘smoothed’ or ‘adjusted’ moving averages because they don’t use the same values each time over their chosen period.
You’ll see these values on some charts, which can be confusing because they look like simple moving averages when in fact, they are not.
Exponential (EMAs)
This one works in much the same way as the simple moving average. Instead of adding up and dividing by the number of prices used in the calculation, we multiply each entry in the price/value list by a certain weighting and then add these products together.
This time we divide our result by N-1 rather than N to get an exponential moving average value instead of a simple one.
If this is starting to look familiar, it’s because you’ve worked out already that multiplying and dividing by different numbers can give us different results when dealing with averages!
Weighted (WMAs)
Then there’s the weighted moving average which is best used when you want to assign different amounts of significance or weighting to each value included in the MA calculation.
This is done by multiplying the price involved by a certain amount – which you’ll see on some software packages as a multiplier, or ‘alpha’ as it’s sometimes called.
To work out the weighted MA, you multiply each MA value by its multiplier and add all these products together.
The result is then divided by the total amount of data being used for this calculation, shown as N.
In Summary
Depending on which method you choose, different types of calculations are performed on the historical data before a new number is produced. Still, all types generate a simple average over a specified period.
This gives us our new moving average value, but to get it plotted on price charts, we need to take the reciprocal of this number – an easy way that many charting packages allow you to do this with a built-in option that does it for you. What seems confusing at first will become second nature once you start using it, we promise!


